# Fonts
showtext_auto()
showtext_opts(dpi = 600)
font_add_google("Lato", "main")

# branding
branding <- branding(
  additional_text = "Data: Wikipedia | Day 06 - Dimensions of #30DayMapChallenge",
  github = "gnoblet",
  bluesky = "gnoblet.bsky.social",
  website = "guillaume-noblet.com",
  additional_text_color = "#2b2b2bff",
  text_color = "#2b2b2bff",
  icon_color = "#2b2b2bff",
  icon_size = "13pt",
  text_size = "13pt",
  additional_text_size = "13pt",
  text_family = 'main',
  line_spacing = 2L
)

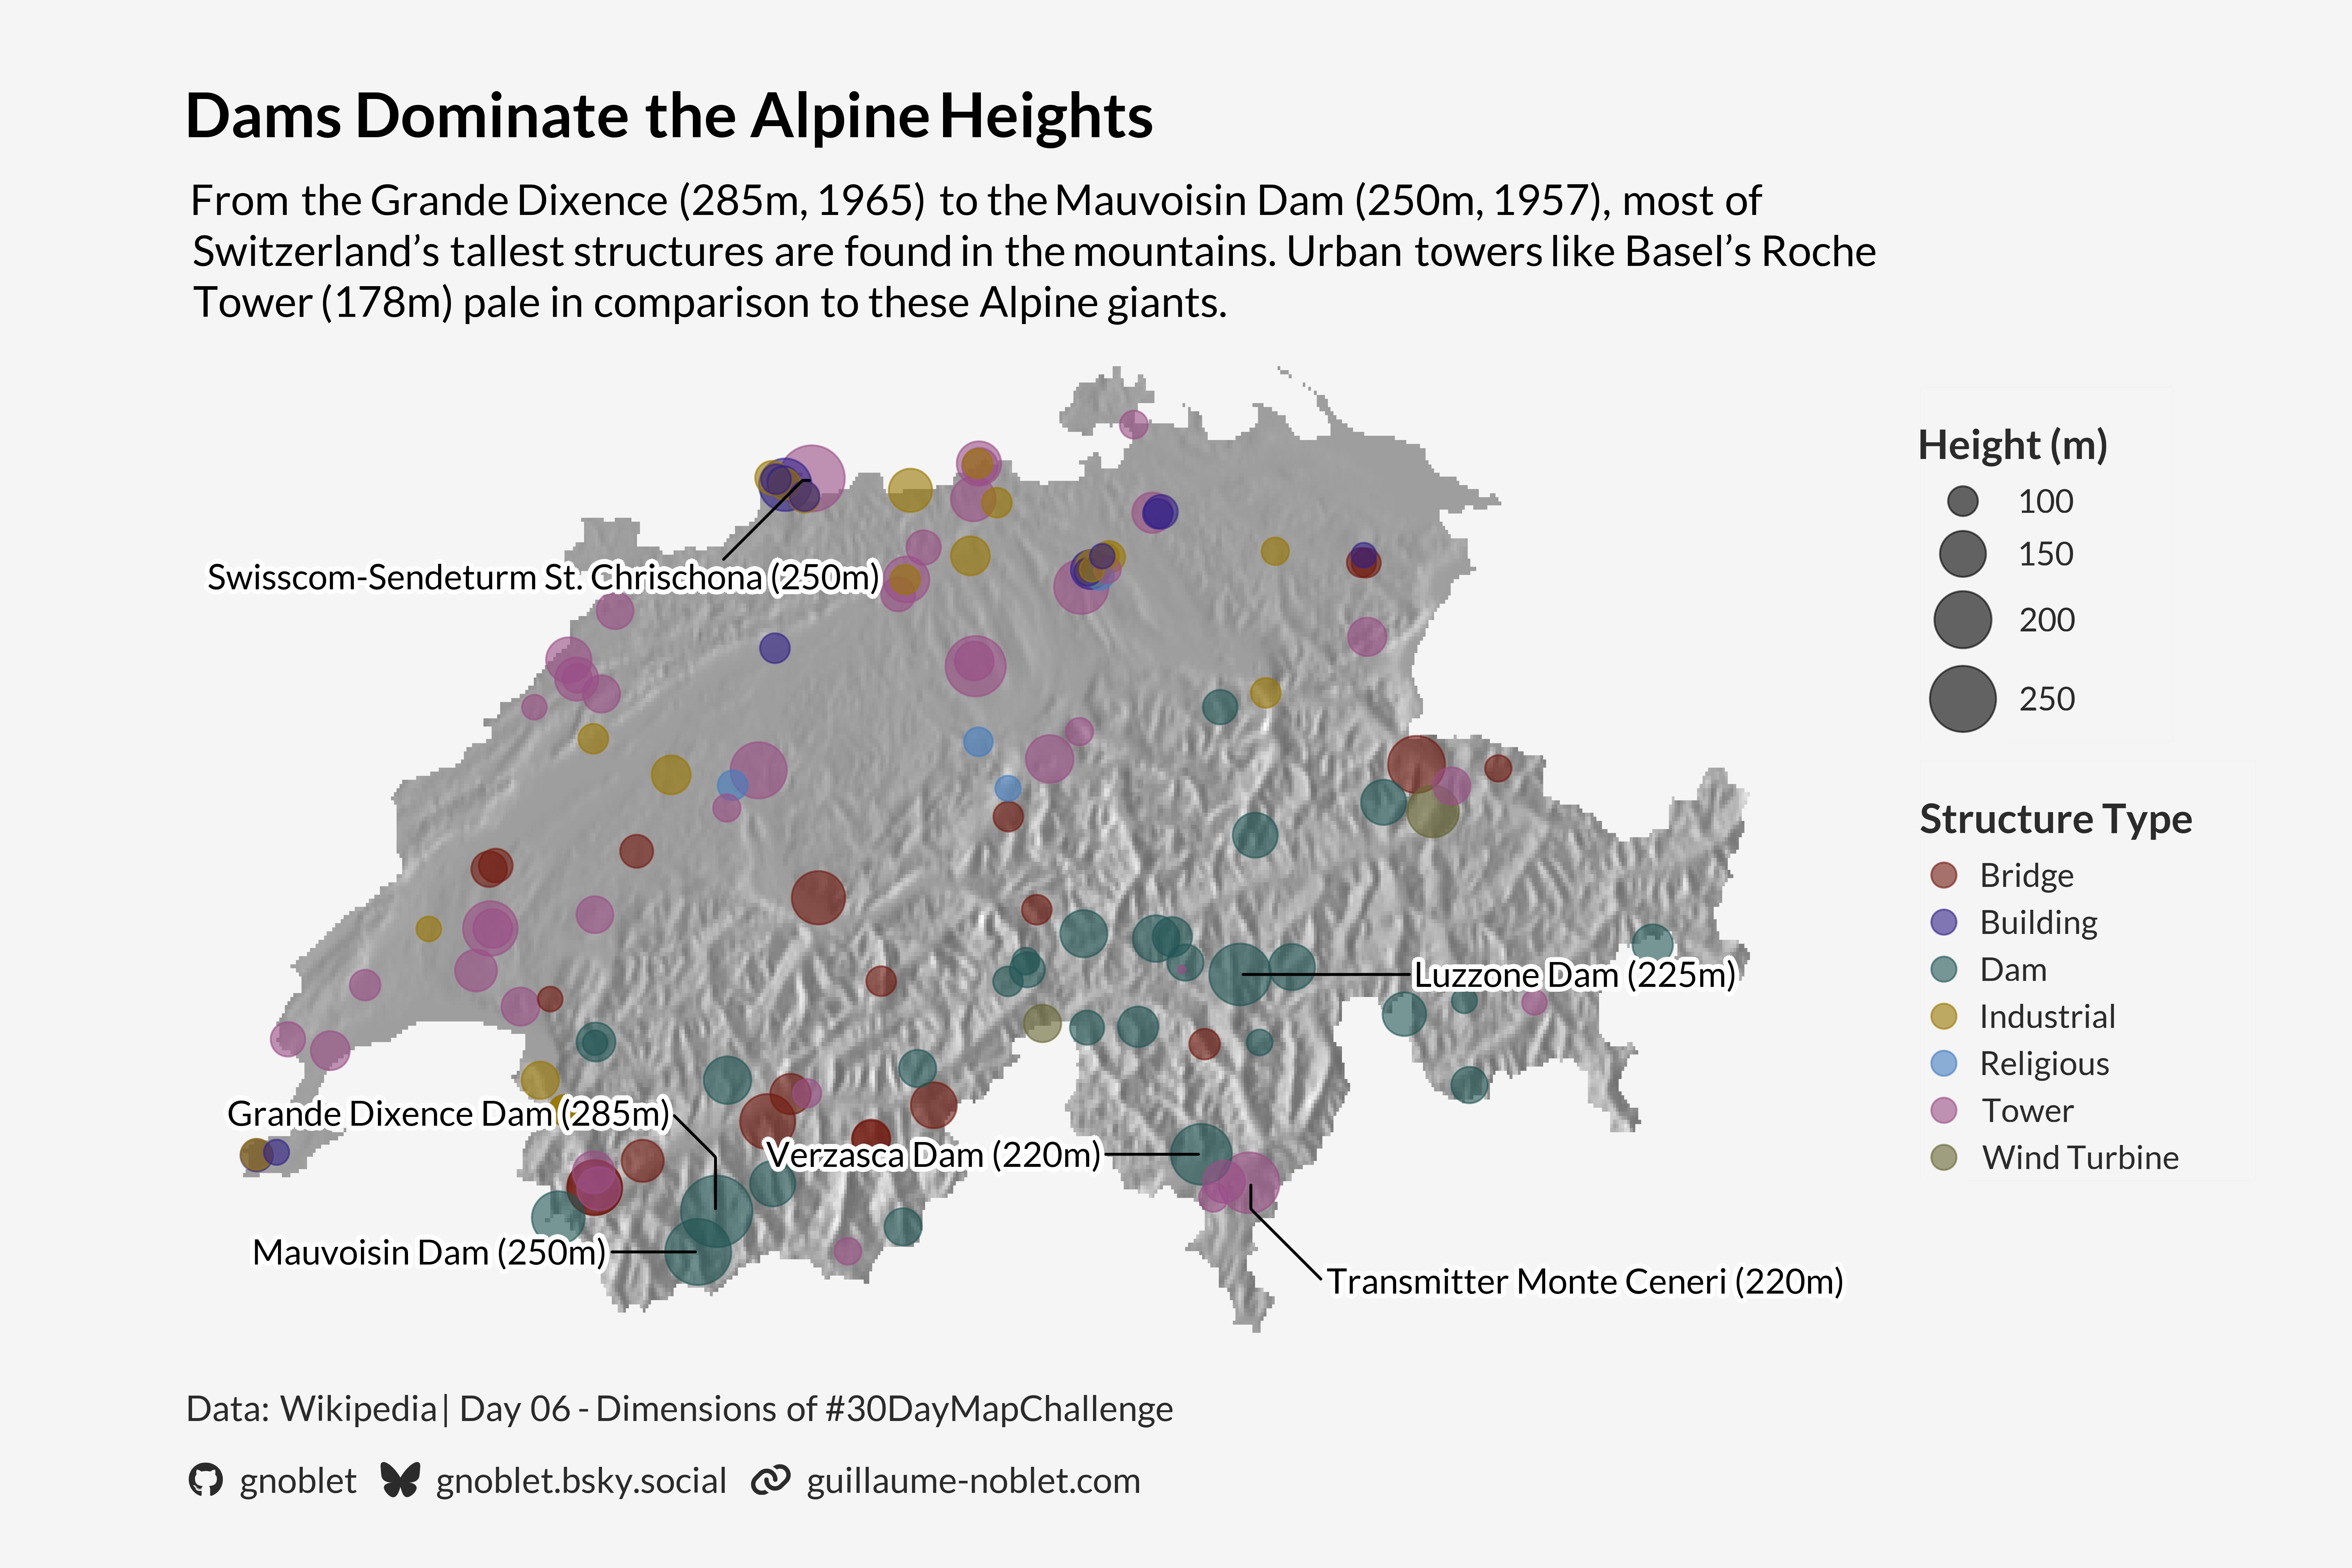
title <- "Dams Dominate the Alpine Heights"
subtitle <- paste0(
  "From the Grande Dixence (285m, 1965) to the Mauvoisin Dam (250m, 1957), most of Switzerland's tallest structures are found in the mountains. Urban towers like Basel's Roche Tower (178m) pale in comparison to these Alpine giants."
)

# Map
p <- ggplot() +
  # Add elevation as raster/contour background
  geom_spatraster(data = hill) +
  scale_fill_gradient(low = "#fbfbfbff", high = "#6a6a6aff", na.value = NA) +
  # Buildings dots
  geom_sf(
    data = buildings,
    aes(size = height_m, color = structure_type),
    alpha = 0.6,
    show.legend = TRUE
  ) +
  # Add building names for tallest ones
  geom_text_repel(
    data = buildings |> slice_max(height_m, n = 5),
    aes(
      label = paste0(construction_type, " (", height_m, "m)"),
      geometry = geometry
    ),
    family = "main",
    size = 4.5,
    # nudge_y up for grand dixence dam and down for Trasmitter and Swisscom
    nudge_y = case_when(
      str_detect(top_buildings, "Grande Dixence") ~ 0.2,
      str_detect(top_buildings, "Transmitter|Swisscom") ~ -0.2,
      .default = 0
    ),
    # nudge_x right for Monte Ceneri and Luzzone dam and left for others
    nudge_x = ifelse(
      str_detect(top_buildings, "Monte Ceneri|Luzzone"),
      1,
      -0.8
    ),
    color = "#000000",
    stat = "sf_coordinates",
    force = 10,
    segment.curvature = -1e-20,
    bg.color = "white",
    bg.r = 0.2
  ) +
  # Colors from cols4all package
  scale_color_discrete_c4a_cat(
    "cols4all.area7d",
    name = "Structure Type",
    guide = guide_legend(override.aes = list(size = 4))
  ) +
  scale_size_continuous(
    range = c(1, 12),
    name = "Height (m)",
    guide = guide_legend(
      title.position = "top"
    )
  ) +
  # no guide for fill
  guides(fill = "none") +
  # Increase y limits top and bottom to add title and caption
  # Based on ch bounding box
  coord_sf(
    ylim = c(st_bbox(ch)["ymin"] - 0.2, st_bbox(ch)["ymax"] + 0.4),
    xlim = c(st_bbox(ch)["xmin"], st_bbox(ch)["xmax"])
  ) +
  # Add branding at the bottom
  geom_richtext(
    aes(label = branding),
    x = 5.8,
    y = st_bbox(ch)["ymin"] - 0.1,
    fill = NA,
    label.color = NA,
    hjust = 0,
    vjust = 0.5,
  ) +
  # Add title
  geom_richtext(
    aes(label = title),
    x = 5.8,
    y = st_bbox(ch)["ymax"] + 0.3,
    fill = NA,
    label.color = NA,
    hjust = 0,
    family = "main",
    fontface = "bold",
    size = 8
  ) +
  # Add subtitle
  geom_textbox(
    aes(label = subtitle),
    x = 5.8,
    y = st_bbox(ch)["ymax"] + 0.2,
    hjust = 0,
    family = "main",
    size = 5.5,
    width = unit(0.95, "npc"),
    box.color = NA,
    fill = NA,
    vjust = 1
  ) +
  # Theme
  theme_void() +
  theme(
    text = element_text(family = "main", size = 15),
    plot.background = element_rect(fill = "#f5f5f5", color = NA),
    panel.background = element_rect(fill = "#f5f5f5", color = NA),
    legend.position = "right",
    legend.background = element_rect(fill = "#f5f5f5", color = "#969696"),
    legend.title = element_text(color = "#2b2b2bff", face = "bold"),
    legend.text = element_text(color = "#2b2b2bff"),
    legend.margin = margin(t = 0.5, r = 0.8, unit = "cm")
  )

# Save
ggsave(
  "day_06.png",
  plot = p,
  width = 12,
  height = 8,
  dpi = 600
)