library(rio)
library(data.table)
library(ggplot2)
library(ggtext)
library(refugees)
library(gghighlight)
library(paletteer)

# get population data
dat <- refugees::population
setDT(dat)

# sum total number of refugees per year
dat_sum_year <- dat[,
  lapply(.SD, function(x) sum(x, na.rm = TRUE)),
  .SDcols = c("refugees", "asylum_seekers", "returned_refugees", "idps", "returned_idps", "stateless"),
  by = .(year)]

# add column of total
dat_sum_year[, all_pop := refugees + asylum_seekers + returned_refugees + idps + returned_idps + stateless]

# melt to long
dat_sum_year_long <- melt(
  dat_sum_year,
  variable.name = "pop_type",
  value.name = "n",
  id.vars = c("year")
)

# recoding categories
cat <- c(
  "refugees" = "Refugees",
  "asylum_seekers" = "Asylum Seekers",
  "returned_refugees" = "Returned Refugees",
  "idps" = "IDPs",
  "returned_idps" = "Returned IDPs",
  "stateless" = "Stateless",
  "all_pop" = "Total"
)


dat_sum_year_long[, pop_type := factor(pop_type, levels = names(cat), labels = cat)]

# plot
 g <- ggplot(dat_sum_year_long[pop_type != "Total"],
       aes(x = year, y = n, group = pop_type, color = pop_type)) +
  geom_line(size = 1) +
  gghighlight(pop_type %in% c("Refugees", "IDPs"),
              use_direct_label = TRUE,
              unhighlighted_params = list(color = "gray60", size = 0.2)) +
  theme_dark(base_size = 14) +
  scale_color_manual(values = c(
    "Refugees" = "#00B4D8",
    "IDPs" = "#FF3D7F"
  )) +
  scale_y_continuous(
    labels = scales::label_number(scale_cut = scales::cut_short_scale()),
    breaks = scales::breaks_extended(8)
  ) +
  # x scale with dates every 10 years
  scale_x_continuous(
    breaks = seq(1950, 2025, 10),
    limits = c(1950, 2025)
  ) +
  # vline in 2015
  geom_segment(
    x = 2016,
    xend = 2016,
    y = -4e6,
    yend = 7.2e7,
    color = "#FFD700",
    linetype = "dashed",
    size = 0.3
  ) +
  annotate(
    geom = "text",
    x = 2016,
    y = 7.4e7,
    label = "2016 Grand Bargain",
    color = "#FFD700",
  ) +
  geom_segment(
    x = 2005,
    xend = 2005,
    y = -4e6,
    yend = 6.2e7,
    color = "#FFD700",
    linetype = "dashed",
    size = 0.3
  ) +
  annotate(
    geom = "text",
    x = 2005,
    y = 6.4e7,
    label = "2005 reform",
    color = "#FFD700"
  ) +
  labs(
    title = "NULL",
    x = NULL,
    y = NULL
  ) +
  theme(
    plot.title = element_text(color = "#FF6F61", size = 18, hjust = 0,
                              margin = margin(b = 20, l = -50)),
    plot.title.position = "plot",
    panel.background = element_rect(fill = "gray10"),
    plot.background = element_rect(fill = "gray10"),
    panel.grid.major = element_line(color = "gray25"),
    panel.grid.minor = element_blank(),
    axis.text = element_text(color = "white"),
    axis.line = element_line(color = "white")
  ) +
  geom_textbox(
    aes(x = 1955, y = 6.6e7),
    label =
      "<span style='color:#FFD700;font-size:28pt;'>Global Displacement Trends</span><br>
      <span style='color:#FFC300;font-size:18pt;'>Refugees and IDPs (1951-2024)</span><br><br>
      <span style='color:#FFFFFF;font-size:12pt;'>
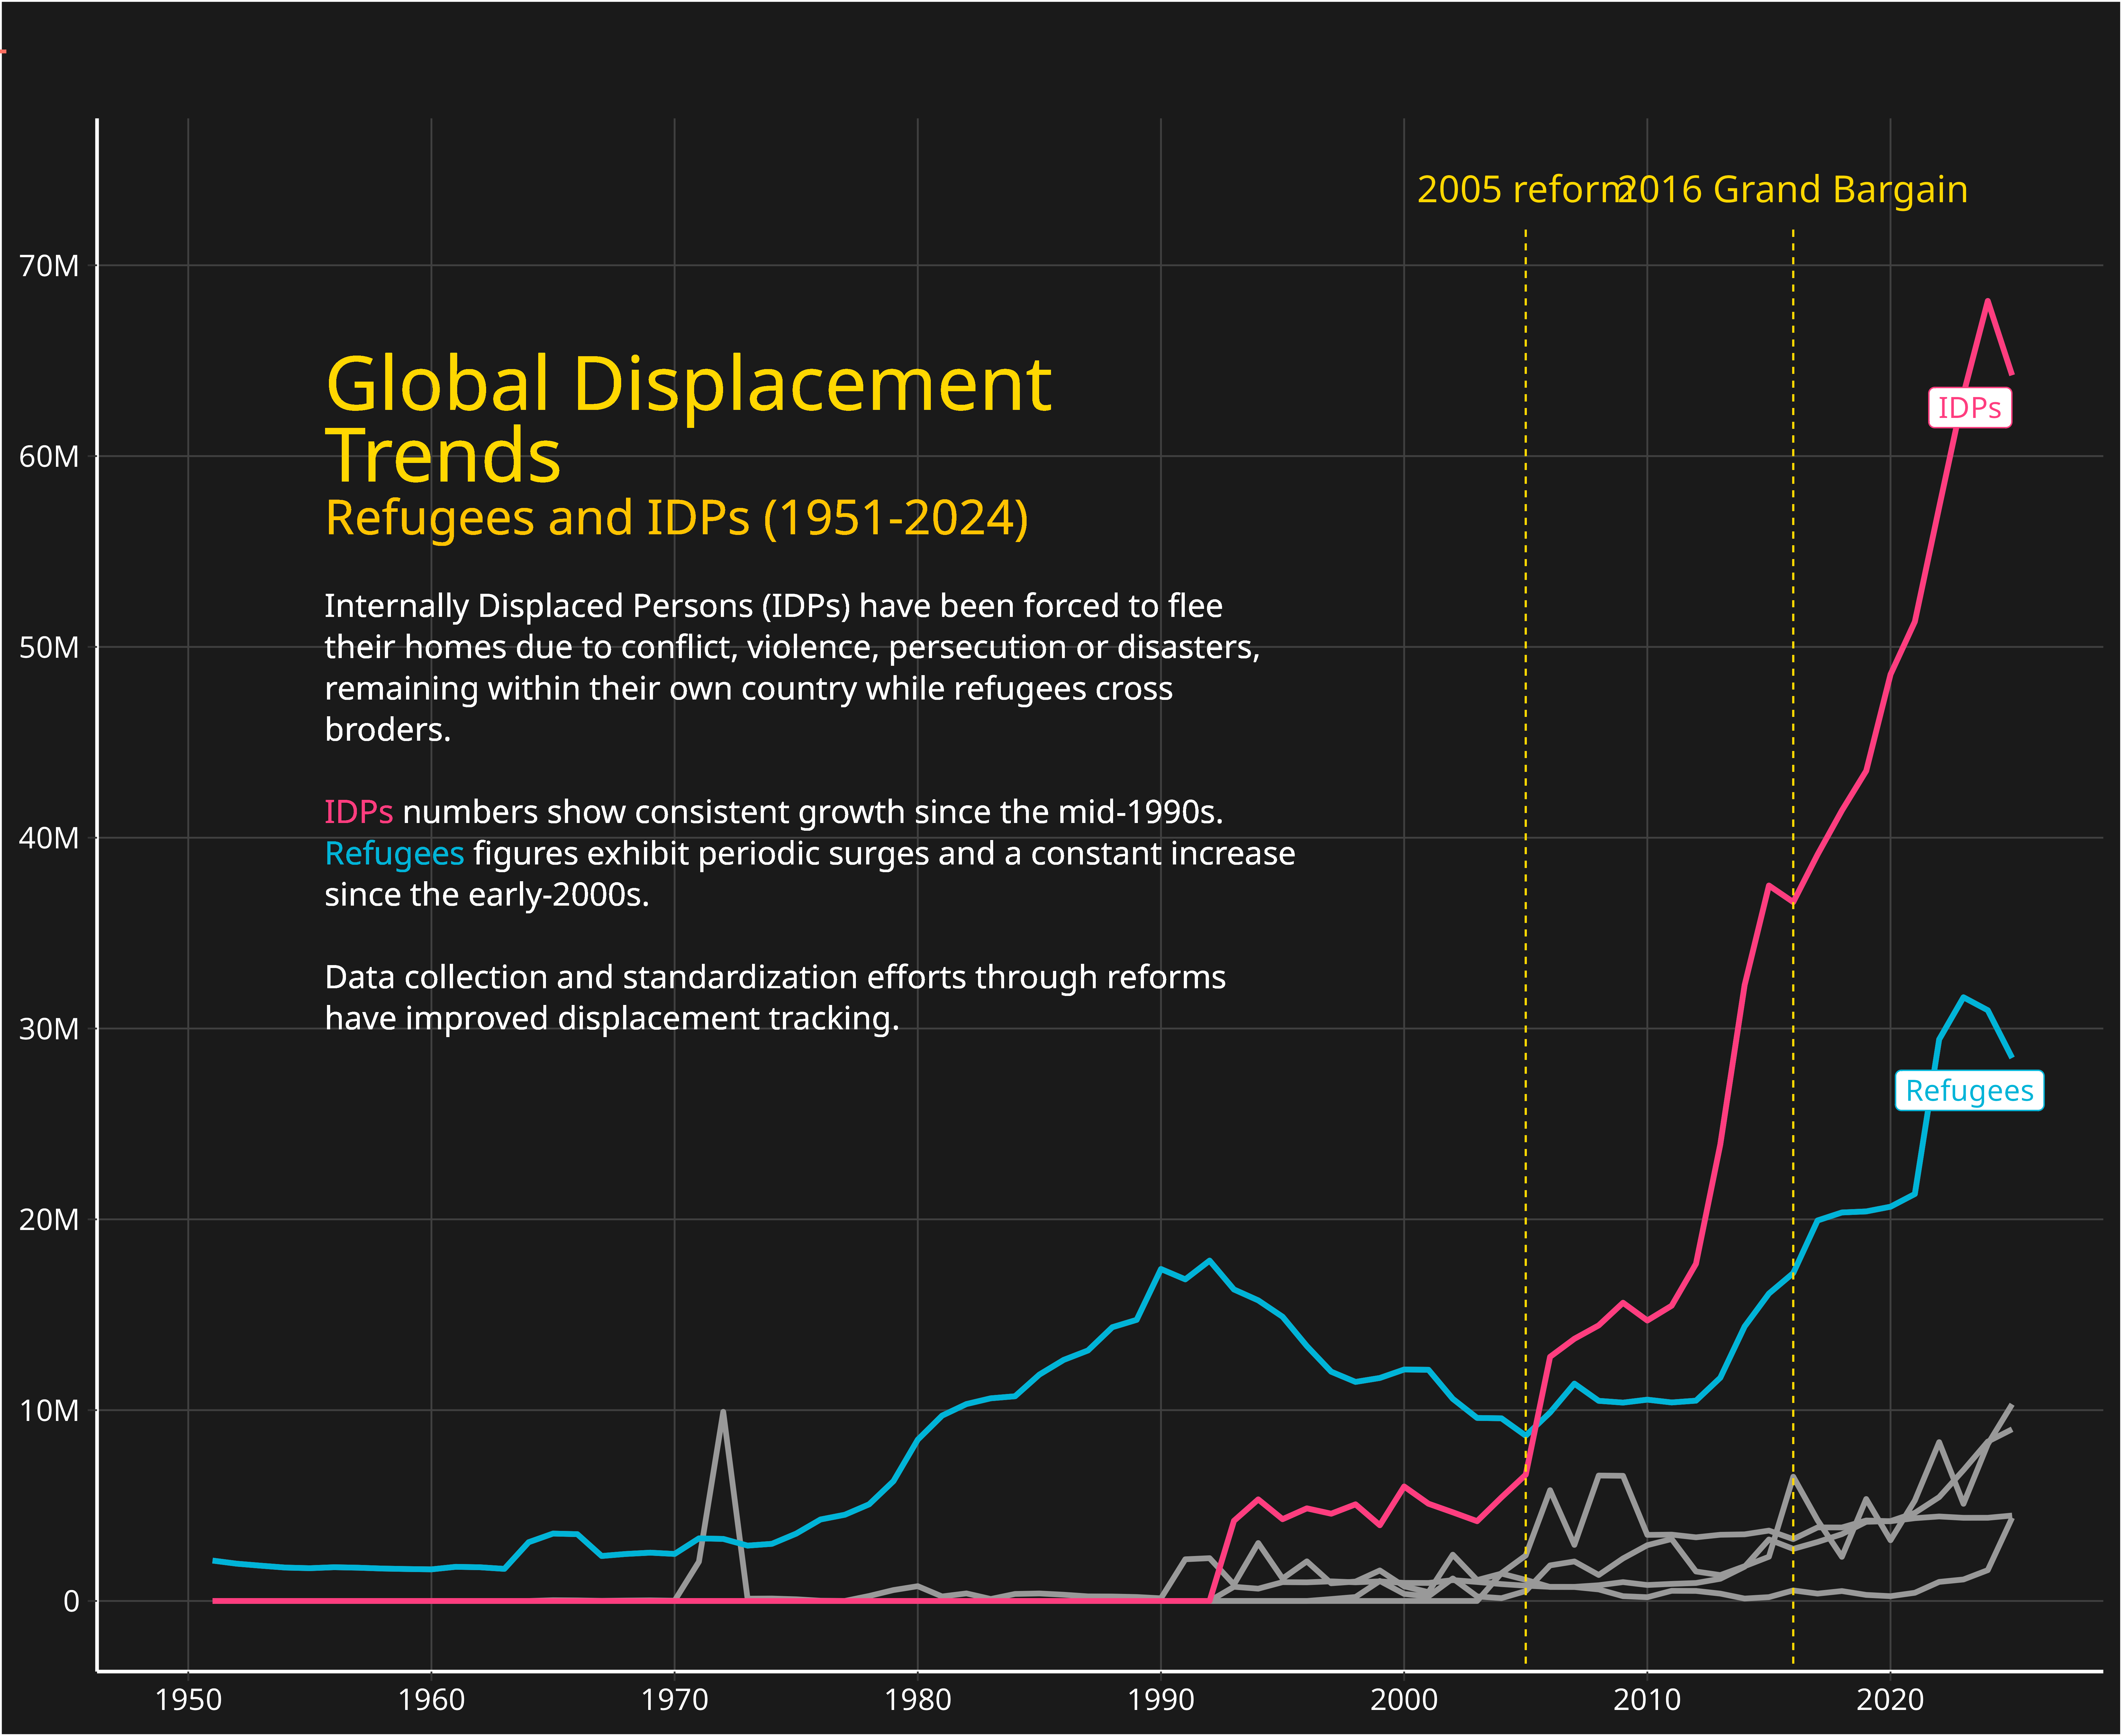
      Internally Displaced Persons (IDPs) have been forced to flee their homes due to conflict, violence, persecution or disasters, remaining within their own country while refugees cross broders.<br><br>
      <span style='color:#FF3D7F'>IDPs</span> numbers show consistent growth since the mid-1990s. <span style='color:#00B4D8'>Refugees</span> figures exhibit periodic surges and a constant increase since the early-2000s.</i><br><br>
      Data collection and standardization efforts through reforms have improved displacement tracking.</span>",
    box.color = NA,
    fill = NA,
    width = grid::unit(0.5, "npc"),
    lineheight = 1.4,
    hjust = 0, vjust = 1
  )

# save
ggsave(
  "day_02.png",
  height = 9,
  width = 11,
  dpi = 600,
  type = "cairo-png"
)